As promised, here they are: the results of my last blood test, taken on February 29th, 2016, after more than 1000 km of running. First surprise: my total cholesterol level increased again! Am I worried? Not at all, because my HDL cholesterol value (the so-called "good" one), made a jump forward as well, so now my total cholesterol/HDL ratio is below 5 (4,2), meaning that the risk for heart disease is now lower than in the past 12 months. This is the reason why I can put up with my high total cholesterol level (set off by satisfactory triglycerides values), even if I have to admit that I would like to see it going under 200. But maybe this is impossible, considering my genetic predisposition (see this post here).
Let's have a look at the values, compared with the last two blood tests I took in April and July 2015.

I highlighted the last two numbers at the bottom end on the right side of the chart, as they prove the progress I made on the last 12 months. You might say: "you shouldn't be so happy, as your total cholesterol level increased!". Well, I remind you that this value includes also the HDL value, which changed from 49 to 62 (and this explains why the tot-cholesterol is now higher ), whereas the LDL level (the "bad guy") decreased. Now some basic conclusion: it seems it's very hard to make HDL raise and the total cholesterol level drop at the same time (a question for a real doctor: is that actually possible?). Anyway, what keeps the smile on my face is the fact that the two ratios on the chart in fact decreased, and that my HDL level corresponds now to the value of a "real" long-distance runner (athletes' HDL is usually above 60).
And here some more "advanced" charts I made. Honestly, their scientific value is very poor, nevertheless I enjoyed a lot collecting these data and turning them into graphics.
Chart 1

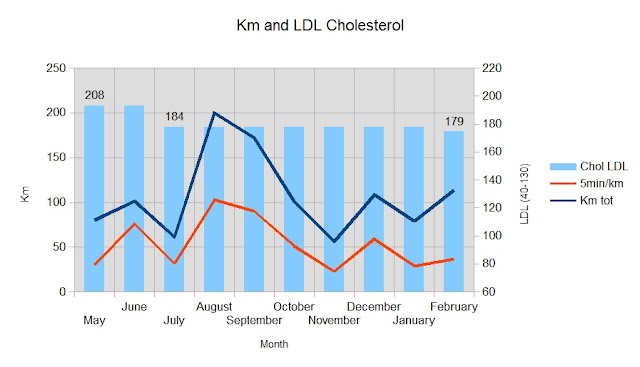
The yellow columns, that represent the total cholesterol levels, refer to the range of the Y axis on the right, whereas the kilometers I ran refer to that on the left. Every week, I kept track of the distances I covered, specifying how many kms I ran keeping a pace below 5 minutes per km (a running style that, according some study, produces effects on the HDL level). Unfortunately I was not able to take a blood test in October, so I couldn't detect the potential benefits of my summer performances, which were quite intense.
Chart 2
Chart 2

Here come the good news (and some food for thoughts): if the moderate physical exercise I did in spring 2015 didn't have any significant impact on the HDL level, the August and September performances (see especially the red line) seem to have produced a considerable increase of this value, which is now above 60. Possible conclusion: increasing your mileage and your speed (meaning: running 10 km under 50 minutes 2/3 times per week) has an impact on your HDL value.
Chart 3
 If you have doubts about it, this chart shows how physical activity and a junk-food free diet help decreasing the "bad" cholesterol level, even if in my case the change is not that sizable. Actually, in the last months the LDL value didn't drop as I expected, but at least it did not increase either, which is ok for me. Thanks to the new lifestyle, the drop since April 2015 to now is an encouraging - 14%.
Chart 3

Chart 4

Having a look at this chart, I can see that my triglycerides level has slightly increased: I have to admit that I am less strict than in the past months when it comes to food, and I indulged myself in occasional "escapades" that might have influenced the current value, which is however quite good.
Chart 5

This chart is a bit messy: the columns show the Total, LDL and HDL cholesterol levels, plus the Triglycerides, whereas the dotted lines represent respectively the total amount of kilometers I have run all over the last 10 months (blue line) and those I've run fast (< 5 min/km pace, red line). Let's turn all this into a working hypothesis: an average of around 50 km (fast) and 100 km (jogging pace) monthly running might contribute to a drop and then to a stabilization of triglycerides levels and a decrease of LDL cholesterol values. HDL values might improve, but only if the monthly mileage increases considerably (see previous charts).
Conclusions
As I always say, I am not a doctor, so the interpretation of the data above are completely unscientific. However, throughout the last year, I've learned many new things about cholesterol, running and healthy lifestyle, and today results are an incentive to run longer and faster, even if I am getting older and outside the cold wind keeps blowing. But this will not discourage me: as the Boss says, we are born to run!
No comments:
Post a Comment